SECOND QUARTER 2023 INVESTMENT COMMENTARY
MARKET RECAP
Global equities continued to rally in the second quarter, led by surging U.S. mega-cap technology and growth stocks, particularly anything related to Artificial Intelligence (AI).
The S&P 500 index gained 6.6% in June and 8.7% in the second quarter, driving its year- to-date return to 16.9% overall. The technology heavy Nasdaq Composite has driven the majority of returns in U.S. stocks, rising over 13% in the second quarter, and 32% year to date.
Outside the U.S., stocks in Europe and emerging markets have also posted solid results. Developed international stocks (MSCI EAFE Index) rallied 4.6% in June, gaining 3% for the quarter and 11.7% YTD. Emerging markets stocks (MSCI EM Index) rose 3.8% in June, resulting in a 0.9% gain for the second quarter and a 4.9% return YTD.
Moving to the fixed-income markets, core bond returns (Bloomberg U.S. Aggregate Bond Index) were slightly negative for the quarter as interest rates slightly rose/prices fell. The benchmark 10-year Treasury yield ended the second quarter at 3.8%, up from 3.5% at
the end of March. Riskier high-yield bonds (ICE BofA U.S. High Yield Index) gained 1.6%
for the quarter and are up 5.4% YTD. Municipal bonds (Morningstar National Muni Bond Category) were generally flat on the quarter and up 2.3% YTD. Actively managed flexible/ nontraditional bond funds (Morningstar Nontraditional Bond Category) gained around 2% and are up over 5% for the year.

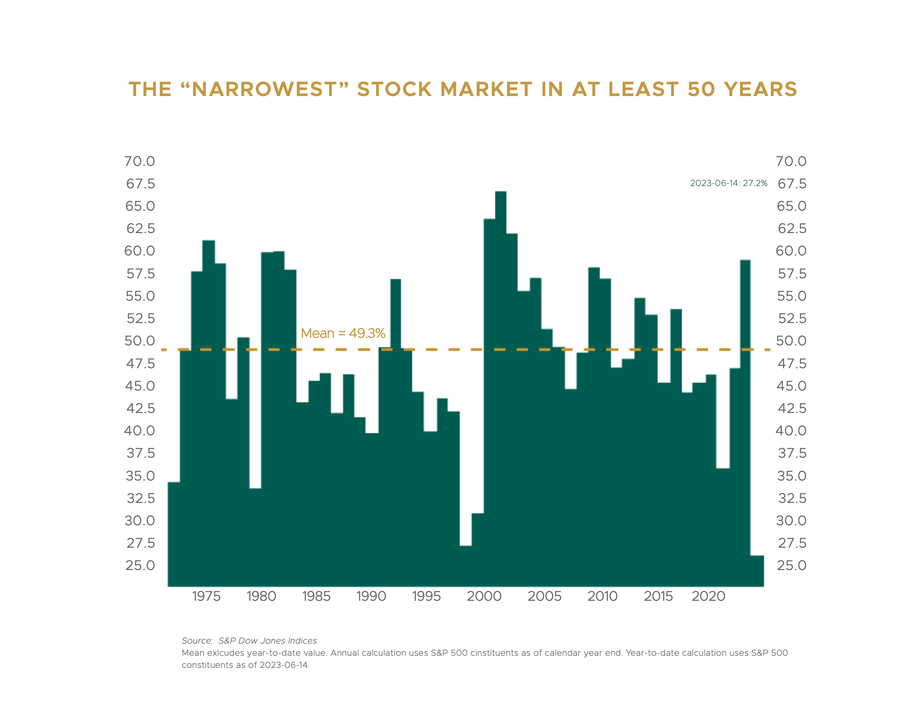
THE NARROWEST STOCK MARKET IN AT LEAST 50 YEARS
The market-cap-weighted S&P 500 Index’s rally this year has been one of the narrowest on record, with less than 28% of the index’s constituents beating the overall index return. As shown in the Ned Davis Research chart on the following page, in an average year around 49% of the index’s 500 companies beat the overall index. (The only other year comparable to this year was 1998, as the Tech/Internet stock bubble was inflating. That didn’t end well, but it took another 15 months before it started to burst).
More granularly, with the sudden frenzy in all things AI, the average YTD return for Amazon, Google, Meta, Microsoft, NVIDIA, and Tesla is 96%. The gains in these six mega cap tech stocks are responsible for almost the entire S&P 500 return for the year. Moreover, the combined market cap of these six stocks (plus Apple), now comprises over 27% of the total index, the largest concentration in history for the top seven stocks.
It remains to be seen whether this extremely narrow market rally resolves via the rest of the market catching up or the seven companies mentioned above “catching down,” but improved market breadth would be a positive indicator for the market’s continued bull run. On a positive note, it appears the stock market rally is potentially broadening to other sectors and markets caps, the small-cap Russell 2000 index shot up 8.1% in June, while the large-cap Russell 1000 value index delivered similar gains of 6%.
INVESTMENT OUTLOOK AND PORTFOLIO POSITIONING
The current macroeconomic data continue to send mixed signals. On the one hand, the
U.S. economy has been more resilient than we (and many others) expected through the first half of the year. The economy has grown, albeit at a subpar rate. The labor market has remained very strong, supporting consumer spending; and headline inflation has dropped meaningfully, thanks to a sharp decline in energy prices. On the other hand, key leading indicators of an impending recession are still flashing red, including a deeply inverted yield curve and tightening credit conditions, among others. Moreover, although the Federal Reserve paused its aggressive interest rate hiking campaign in June, core inflation (excluding food and energy) remains stubbornly high, with the Fed signaling it will resume rate hikes later this year, further raising the likelihood of a recession.
As we read the muddy economic tea leaves through our cloudy crystal ball, we maintain our view that a recession is the most likely outcome over the next few quarters. Historically, the odds are unfavorable for the economy avoiding a recession after the Fed has been aggressively tightening. And we have yet to see the full (lagged) impact of this cycle’s monetary tightening on the real economy.
However, a near-term recession is not a certainty. Each cycle is somewhat different and this one is considerably so due to the pandemic dislocations, and there have been three instances (out of 13) where the Fed tightening cycle ended without a recession. So, a more benign near-term outcome is certainly possible, and the current growth and inflation trajectory is not inconsistent with that.
Just as the U.S. economy has been more resilient than expected in the face of aggressive Fed tightening this year, the U.S. stock market (S&P 500) has been as well — and then
some — gaining nearly 17%. There are always multiple factors driving the markets, but we think the key drivers of this year’s strength include the fact that the economy and corporate earnings have held up better than many expected, the markets are optimistic that the Fed will soon end its tightening cycle, and most importantly, investor euphoria around Artificial Intelligence.

Specific to the last point, we’d argue that while it is likely AI will have a huge impact on society and the global economy, that doesn’t necessarily mean the current AI stock frenzy is justified by these companies’ underlying earnings fundamentals. It may be in some cases. But we can also remember the tech/internet stock bubble in 1998-2000. The internet obviously has had huge economic impact over the past 25 years, but very few tech stocks were priced appropriately in early 2000.
As an example, a poster child for the current AI exuberance is Nvidia, a graphics chip maker used in AI applications. The stock is up over 200% this year (as of June 30, 2023), pushing its market cap over $1 trillion and into the top-10 largest constituents of the S&P 500. Nvidia has strong fundamental earnings growth potential, but its stock is currently trading at a P/E ratio of more than 220x! (The overall S&P 500 index has a P/E around 20x, currently.)
Our view of the U.S. fixed-income markets is positive. With rising yields over the past year, most bond market sectors now offer attractive expected returns relative to their risk.
For example, the yield on the core U.S. Aggregate Bond Index is currently around 4.7%. With inflation very likely to drop below 4%, core bonds are finally providing a positive real (after- inflation) yield. With a duration of around 6 years, the core bond index will also generate strong price gains if interest rates fall during a recession, as we’d expect.
In addition to our core bond exposure, we continue to have a meaningful allocation to higher-yielding, actively managed, flexible bond funds run by experienced teams with broad investment opportunity sets. There are many fixed-income sectors outside of traditional core bonds that offer attractive risk-return potential, and we want to access them via our active managers. These funds are currently yielding in the high single-digits. While the higher yield indicates they carry more credit risk than core bonds, all our active bond managers are very attuned to risk management, especially heading into a late-cycle/recessionary period. And they have the flexibility to tactically vary their portfolio exposures in response to market risks and return opportunities.
CLOSING THOUGHTS
While we believe a recessionary bear market is the most likely outcome over the next 12 months, there are reasons to believe it would be very moderate given the strength of the labor market, ample household savings, and solid corporate balance sheets.
As we extend our time horizon over the next five to ten years, we see reason for optimism. Within the U.S. stock market there are companies and sectors that are reasonably priced and offer attractive return potential. The fixed-income landscape is also attractive, thanks to higher yields and inefficiencies that can be exploited by skilled active managers.
We also see strong total return potential from international and emerging market stock markets, which have been out of favor and underperforming for more than a decade.
These markets are not “priced for perfection” as the U.S. market seems to be. Instead, they are susceptible to “upside risk” — better-than-expected earnings growth and valuation expansion. While foreign markets will get hurt in a near-term recession, we don’t want to try to time “getting out and getting back in” given their attractive five-year return outlook.
We’re investors, not short-term market traders. Strong short-term market trends can trigger our emotions and make us want to act — either chasing (buying into) a rising market or fleeing from (selling) a falling one. That is not the path to successful long-term investment outcomes. In addition, we have exposure to disciplined trend-following strategies that complement our longer-term valuation-based tactical approach.
Successful investing requires a balance between offense and defense. Earning superior long-term returns does require one to take calculated risks when opportunities present themselves, but to also exercise caution during periods of market exuberance. By maintaining a disciplined and balanced investment approach, we are well-positioned to weather the inevitable market storms and capitalize on the opportunities that are also sure to arise.
-The Owen Legacy Group
Note: For discretionary use by investment professionals. This document is provided by iM Global Partner Fund Management, LLC (“iMGPFM”) for informational purposes only and no statement is to be construed as a solicitation or offer to buy or sell a security, or the rendering of personalized investment advice. There is no agreement or understanding that iMGPFM will provide individual advice to any investor or advisory client in receipt of this document. Certain information constitutes “forward-looking statements” and due to various risks and uncertainties actual events or results may differ from those projected. Some information contained in this report may be derived from sources that we believe to be reliable; however, we do not guarantee the accuracy or timeliness of such information. Investing involves risk, including the potential loss of principal. Any reference to a market index is included for illustrative purposes only, as an index is not a security in which an investment can be made. Indexes are unmanaged vehicles that do not account for the deduction of fees and expenses generally associated with investable products. A list of all recommendations made by iMGPFM within the immediately preceding one year is available upon request at no charge. For additional information about iMGPFM, please consult the Firm’s Form ADV disclosure documents, the most recent versions of which are available on the SEC’s Investment Adviser Public Disclosure website (adviserinfo.sec. gov) and may otherwise be made available upon written request.