It's an Election Year! How Will That Affect My Portfolio?
Election season is upon us. If you have made the transition to only subscription entertainment, you may not be being inundated by negative ads, but out in the world it is hard to escape. In almost every conversation we have with clients, inevitably someone will ask, “how will this election affect my portfolio?” Though we are not going to speculate on the coming election, we do take very seriously anything that has our clients up at night.
So, do presidential elections influence the stock market? On one hand, it’s true that the stock market is cyclical, which makes it possible for investors to speculate on trends and attempt to make predictions. We can say things like “there tends to be more volatility leading up to an election.” But we can’t count on future returns to match, mirror or look anything like past ones.
 Studies on Election Years and Market Returns
Comments in this section are adapted from this article.
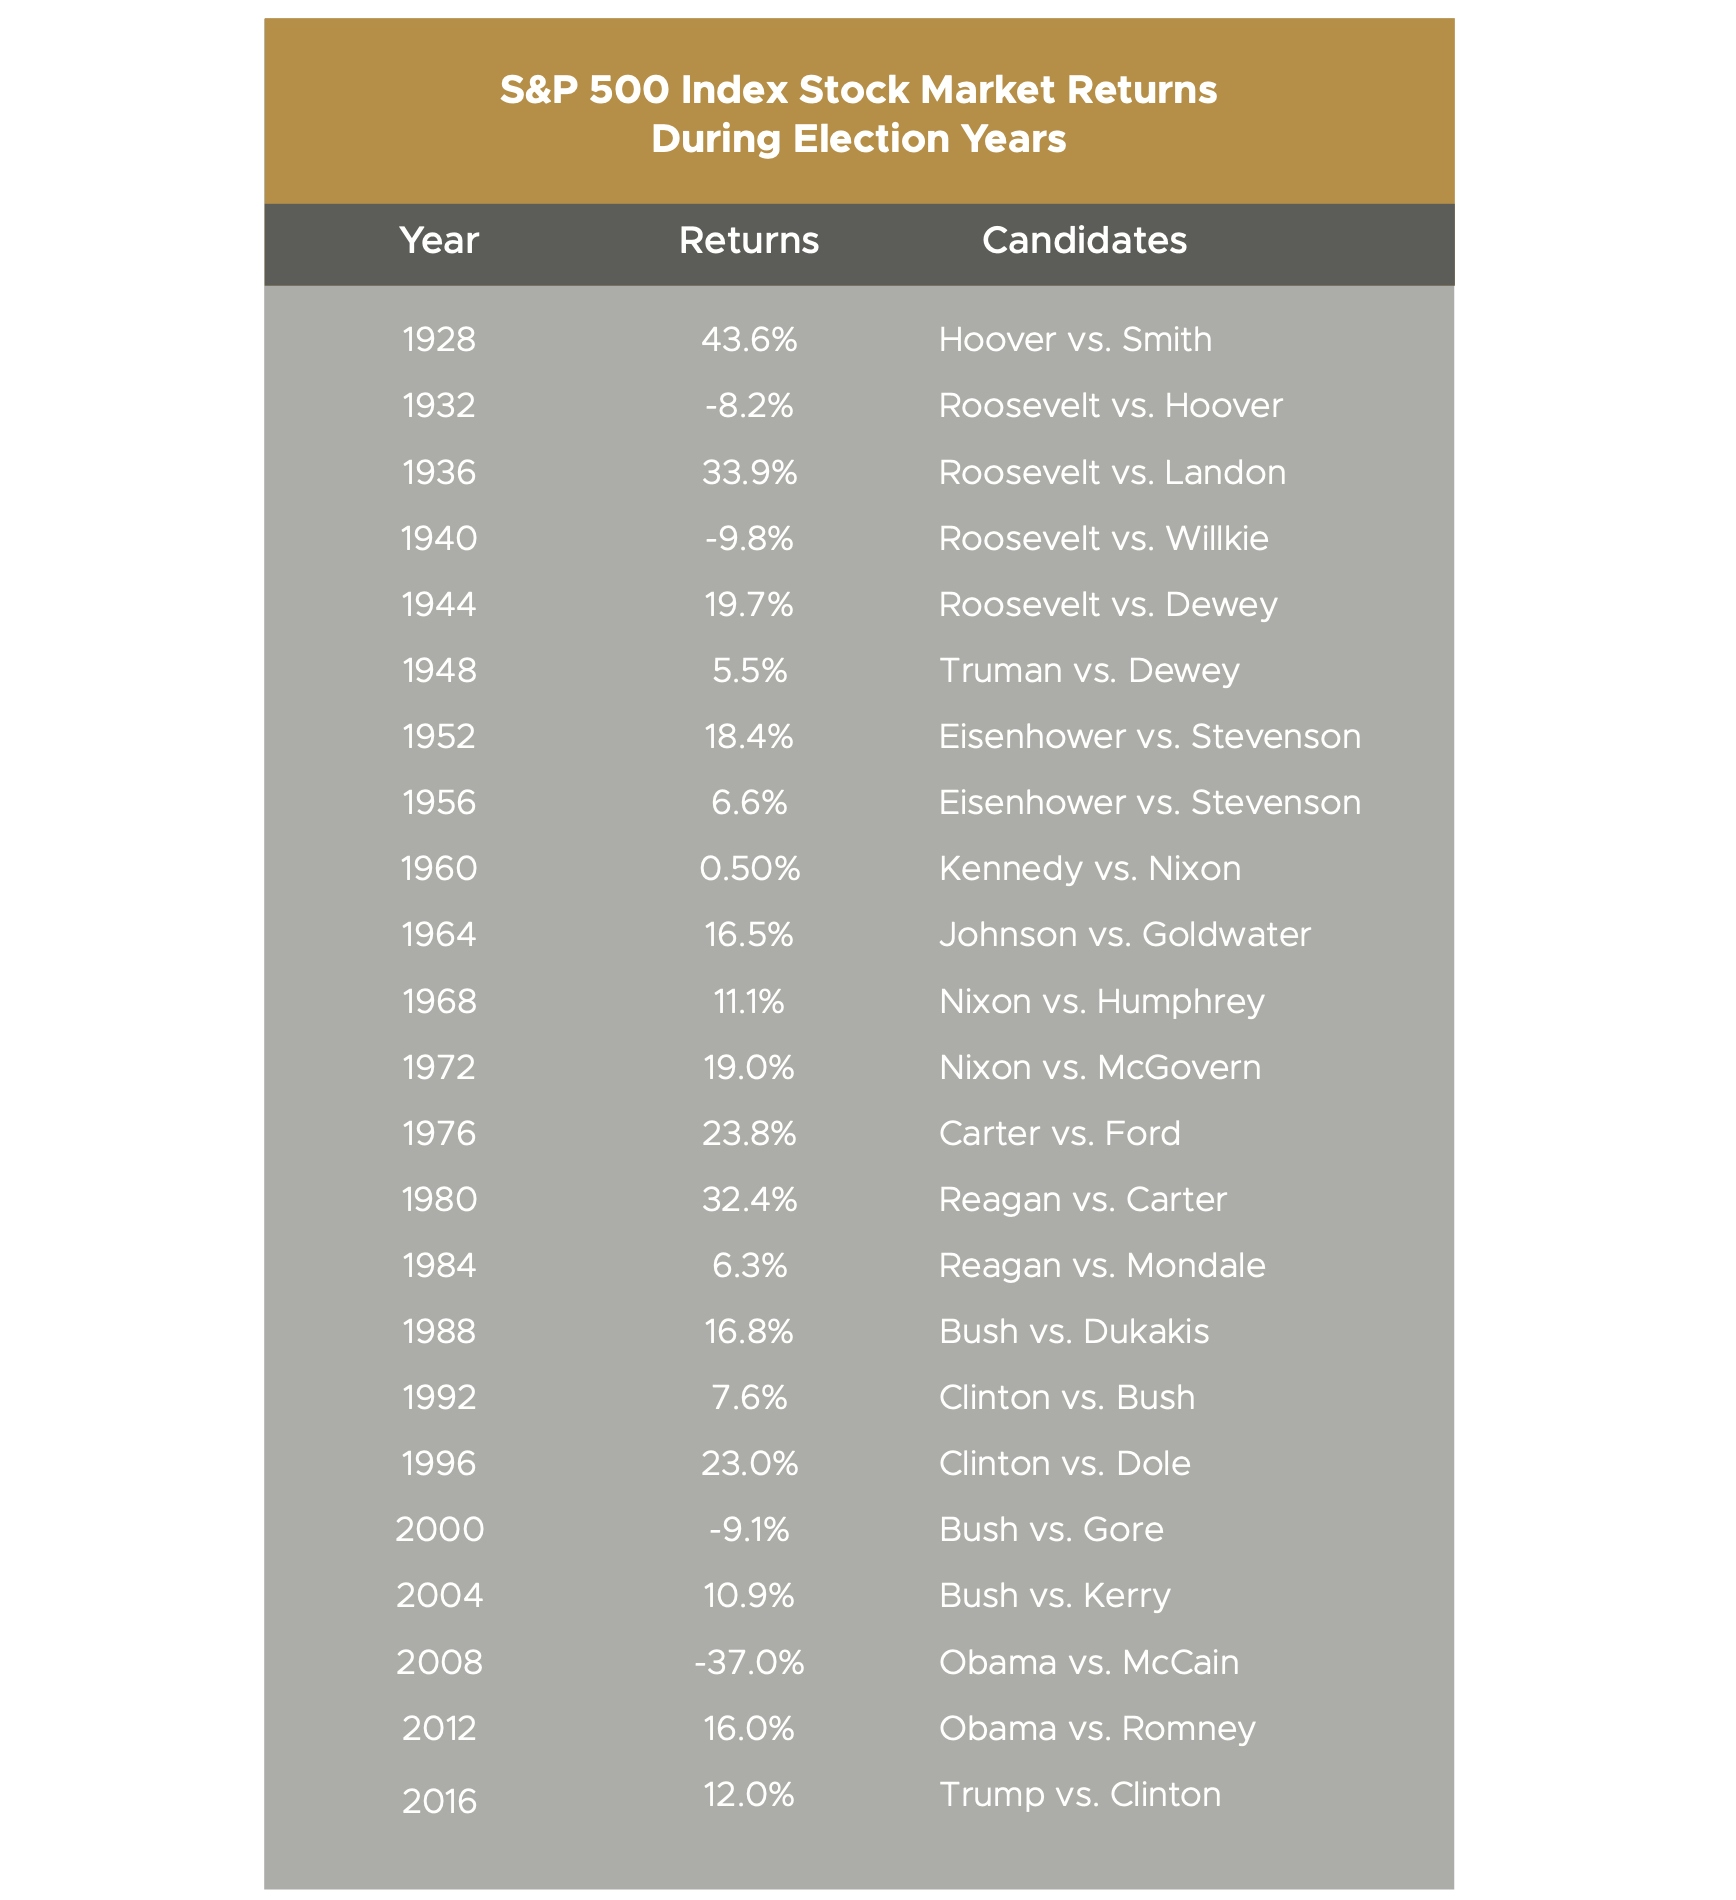
According to the 2019 Dimensional Funds report, the market has been positive overall in 19 of the last 23 election years from 1928-2016, only showing negative returns four times. These years also happen to correspond with major economic recessions 2000, 2008 and now 2020, which we don’t get to count yet since we are only halfway through.
When you further examine the years between elections, however, it becomes apparent that year three of a president’s term is usually the strongest year for the market, followed by year four, then the second, and finally the first. This “Presidential Election Cycle Theory” was originally put forth by Yale Hirsch, creator of the Stock Trader’s Almanac. It was furthered by Pepperdine professor Marshall Nickles, in a paper called “Presidential Elections and Stock Market Cycles,” which presented data showing that a profitable strategy would be to invest on October 1 of the second year of a presidential term and sell on December 31 of year four.
Past Results Don't Guarantee Future Performance
Recent history, however, bucks the trend. During the presidencies of Barack Obama and Donald Trump, these stock market theories did not hold up. In each of Obama’s terms, the first two years were more profitable than the third, and for Trump, the first year was more profitable than the second, before a major surge in his third year, followed by the volatile, coronavirus-plagued markets of 2020.
So what do you do with an investment strategy that works sometimes but not others? You don’t follow it!
If you were to follow Nickles’ theory that the fourth year of a term sees better returns than the first term, the market in 2008 should have had delivered better returns than it did in 2005, when George W. Bush started his second term as president and the S&P 500 Index gained 4.9%. But 2008, an election year, saw returns drop by 37%. If you had followed the theory and invested in the stock market from October 1, 2006, until December 31, 2008, your investments would have been down by 6.8%.
You Can't Beat the Market
The problem with investing based on a data pattern is that it is attempting to predict the future and no one has a crystal ball. It sounds exciting, and it fulfills a belief that there’s a way to “beat the market.” But there are too many other forces at work affecting market conditions. Some we know of, some we don’t, but to our knowledge no one has found a foolproof algorithm that can predict outcomes with any certainty.
In our opinion, it is better to invest the less exciting way — this as you all know, involves understanding and knowing your personal risk tolerance, diversifying, and sticking to your asset allocation for the long run, no matter who wins or loses. As noted economist and Nobel Prize winner Paul Samuelson put it: “Investing should be like watching paint dry or grass grow. If you want excitement ... go to Las Vegas.” If Vegas isn’t your style, then a well-balanced, diversified portfolio that has a risk tolerance specifically built for your needs will get you through this election and many more to come.
Election Year Stock Market Returns
Here are the market results for the S&P 500 for every election year since 1928. Data below is from the Dimensional Funds Matrix Book. Let us know if you find a pattern.